UV-VIS Spectroscopy
Core Concept
involves the absorption of ultraviolet (UV) and visible light by molecules or ions, causing electronic transitions between energy levels. The amount and wavelength of light absorbed provide information about the electronic structure, concentration, and type of substances present, making it a key tool for quantitative and qualitative analysis.
Understand the relationship between wavelength, energy, and electronic transitions.
Practice interpreting absorption spectra, identifying λmax and relating it to potential electronic transitions.
Learn how UV-Vis spectroscopy can be used to identify functional groups and for quantitative analysis.
Explore online simulations and resources that visualize light-matter interactions in UV-Vis spectroscopy.
Test Yourself
Related Examples and Practice Problems
Topic Overview Podcast
Topic Related Resources
|
LABORATORY
|
DEMONSTRATIONS
|
ACTIVITIES
|
VIRTUAL SIMULATIONS
|
Core Concept
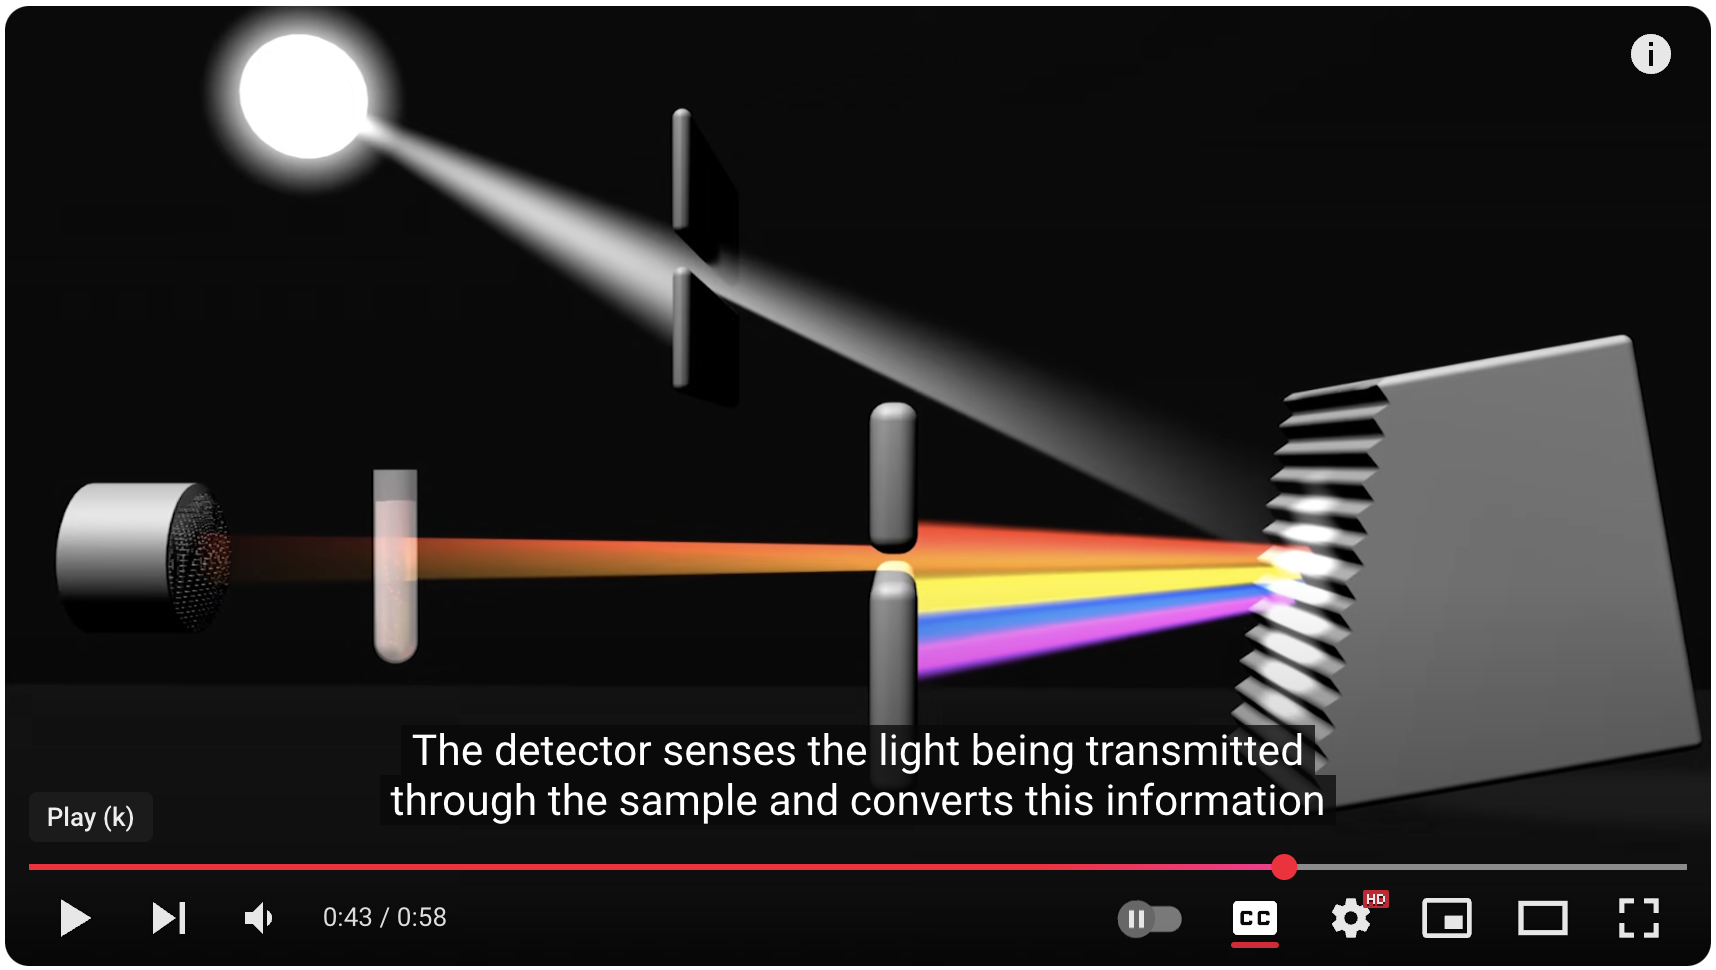
UV-Vis spectroscopy doesn't directly measure the light a molecule absorbs. Instead, it measures the light that gets transmitted through the sample. The key parameter is absorbance (A), which is related to the amount of light absorbed by the sample and the concentration of the absorbing molecule.
Higher absorbance: Indicates a greater portion of light is absorbed, suggesting a strong interaction between the light and the molecule.
Lower absorbance: Indicates less light is absorbed, possibly because the light doesn't have the right energy to excite the molecule.
Interpreting the Spectrum
The results of a UV-Vis experiment are presented as an absorption spectrum, a graph of absorbance versus wavelength of light. This spectrum is like a fingerprint of the molecule, providing valuable information:
λmax (lambda max): The wavelength at which the molecule exhibits maximum absorbance. This value can be linked to the type of electronic transitions occurring within the molecule.
Functional Groups: Different functional groups (e.g., C=C double bonds, carbonyl groups) tend to absorb light at specific wavelength ranges. Analyzing the λmax can help identify these functional groups within the molecule.
Applications of UV-Vis Spectroscopy:
Identifying Unknown Molecules: By comparing the absorption spectrum of an unknown molecule to a library of known spectra, chemists can potentially identify its structure.
Monitoring Chemical Reactions: As a reaction progresses, the concentration of reactants and products might change. UV-Vis spectroscopy can be used to track these changes by monitoring the absorbance at specific wavelengths.
Quantifying Analytes: The relationship between absorbance and concentration can be used to determine the amount of a specific molecule present in a solution.
The Beer-Lambert Law
While Beer's Law is often used independently, it's actually part of a broader principle called the Beer-Lambert Law. This law states that the absorbance (A) of light by a solution is directly proportional to the:
Concentration (c): The higher the concentration of the colored molecule, the more light particles (photons) it has a chance to absorb, leading to higher absorbance.
Path Length (l): This is the length of the light's travel path through the solution. A longer path allows for more interaction between light and molecules, potentially leading to greater absorbance.
The Beer-Lambert Law is expressed by the following equation:
A = ε • l • c
A: Absorbance (unitless)
ε (epsilon): Molar Absorptivity Coefficient (a constant specific to the colored molecule and wavelength of light, with units of L mol^-1 cm^-1)
l: Path Length (usually the width of the cuvette holding the solution, in cm)
c: Concentration of the colored molecule (usually in Molarity, mol/L)
Applications of Beer's Law
Quantifying Unknown Concentrations: If we know the molar absorptivity coefficient (ε) and path length (l) for a specific colored molecule at a particular wavelength, we can measure the absorbance (A) of a solution and use Beer's Law to calculate the unknown concentration (c) of that molecule.
Monitoring Chemical Reactions: As a reaction progresses, the concentration of the colored reactant or product might change. By monitoring the absorbance at a specific wavelength using Beer's Law, we can track the reaction's progress.
Calibrating Spectrophotometers: These instruments measure absorbance. Beer's Law allows us to use solutions with known concentrations to create a calibration curve, relating absorbance to concentration for a specific molecule and wavelength.